Debugging on Windows
Prerequisites
You should be able to build Taichi from source and already have LLVM and related environment variables configured.
note
Familiarize yourself with the Developer Installation Guide.
Recommended Visual Studio plugins:
- Github Co-pilot
- VS Chromium for code search. You might need to go to the release page to find the pre-release version needed for VS2022
Step 1. Turn on MSBuild option in build system
This is a new feature in setup.py, introduced in PR #6724, which enables building Taichi with MSBuild and MSVC. It generates a Visual Studio project file to enable coding and seamless debugging through Visual Studio IDE.
To activate the feature, create a new environment variable called TAICHI_USE_MSBUILD by typing "environment variable" in Windows Search or setting it temporarily with $Env: in PowerShell. Then, set its value to 1 or ON.
After cleaning up the _skbuild folder, if the previously used generator is Ninja, run python setup.py develop and build Taichi from the source.
Step 2. Navigate to the generated Visual Studio Project file
Go to the build folder, which is _skbuild\win-amd64-3.9\cmake-build in the author's case, and double click taichi.sln. You can also open this SLN solution file from Visual Studio. This should open Visual Studio IDE with the setup for Taichi.
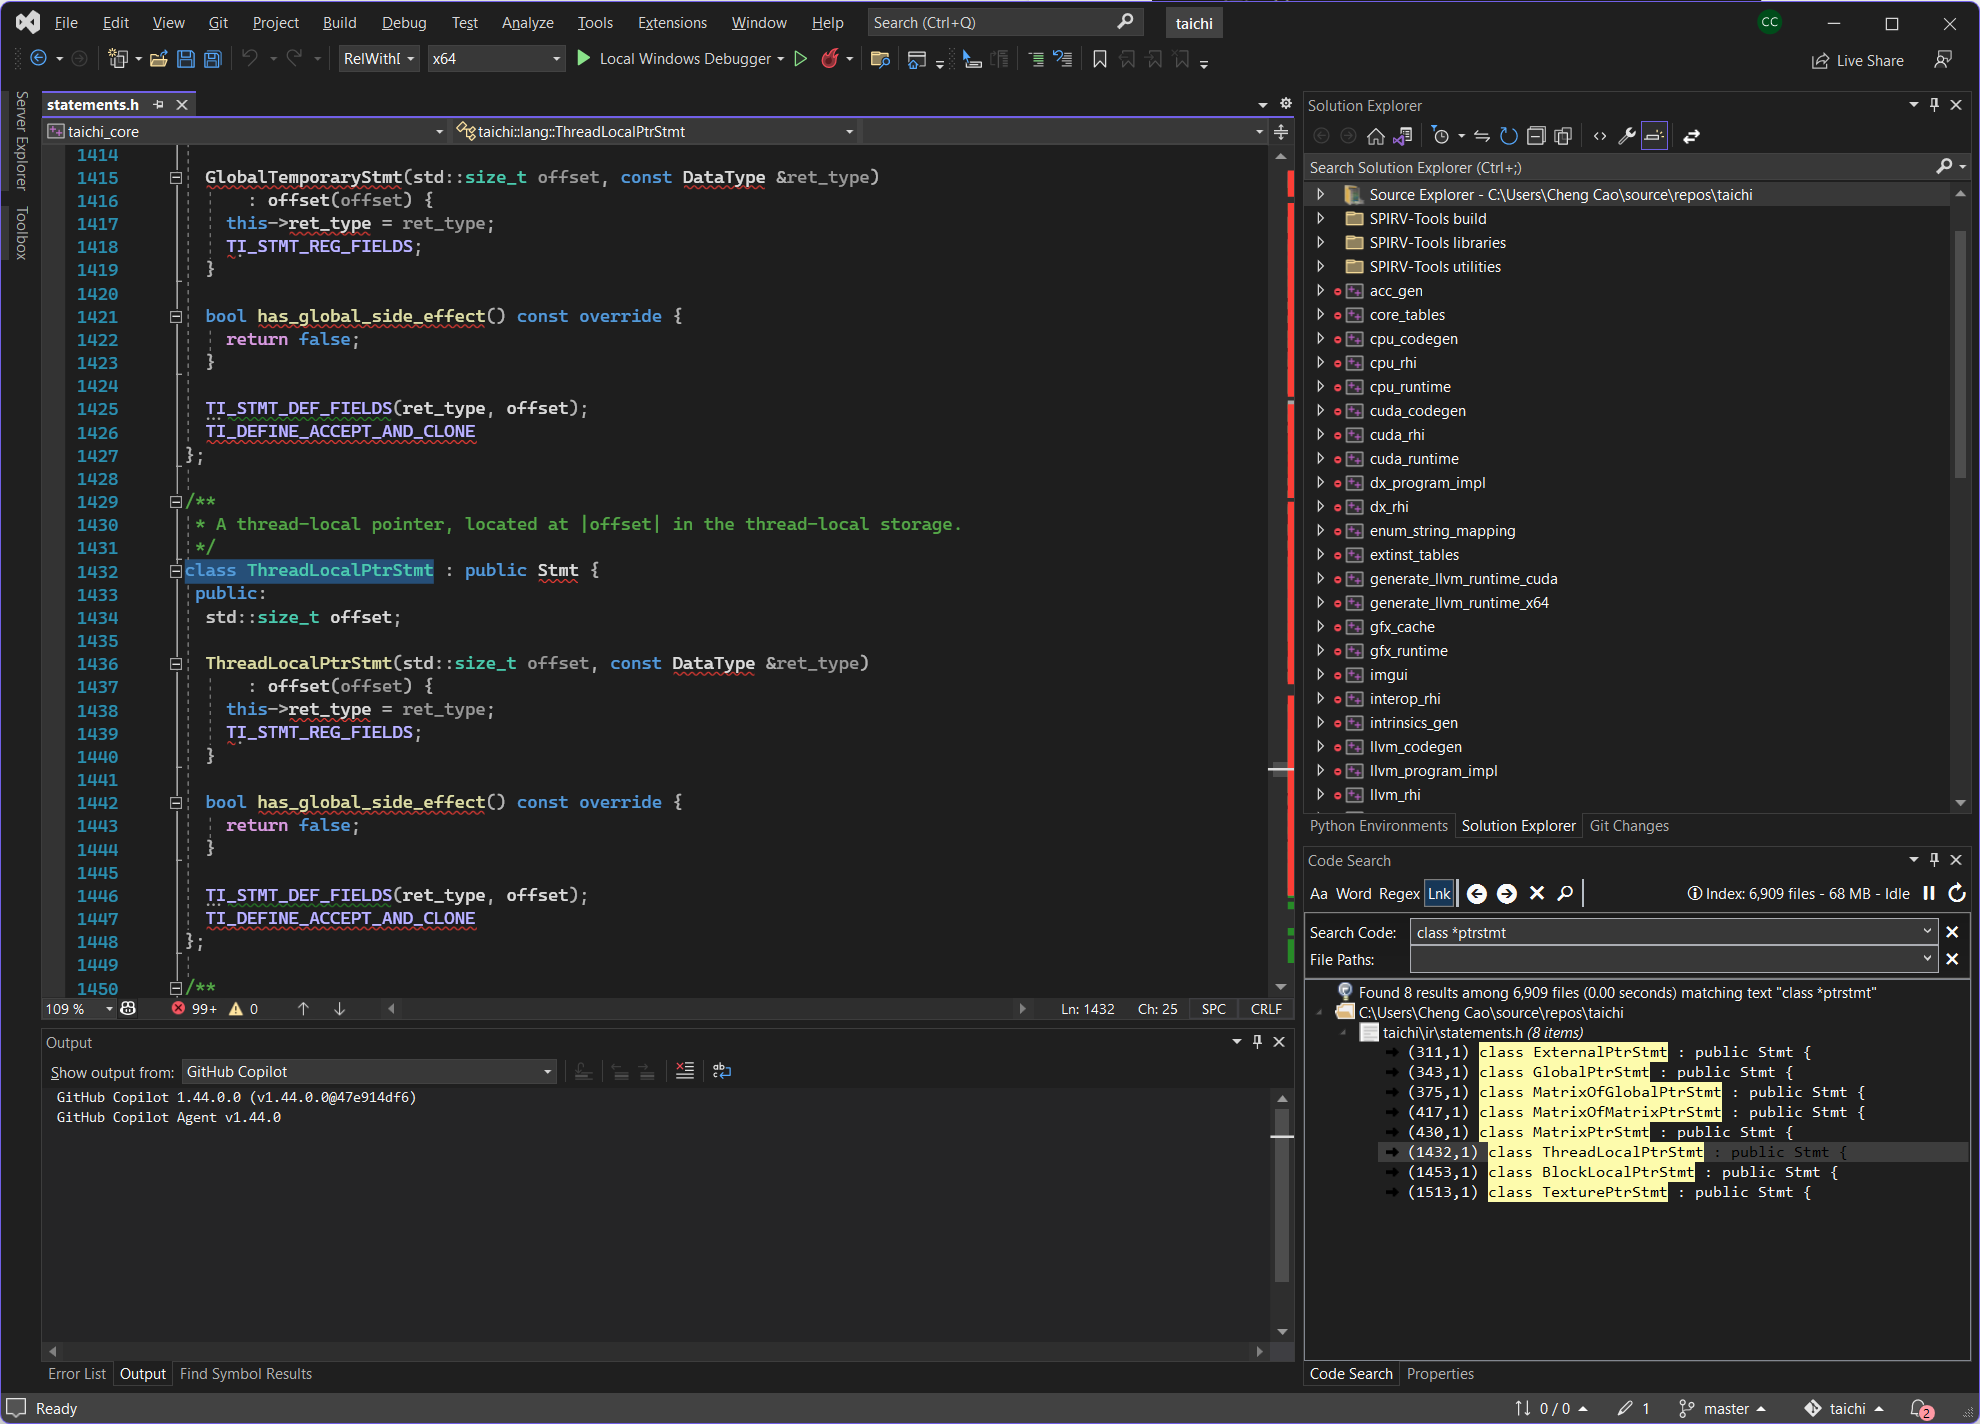
The following image shows a possible layout after Visual Studio is launched. The layout is open to reconfiguration.
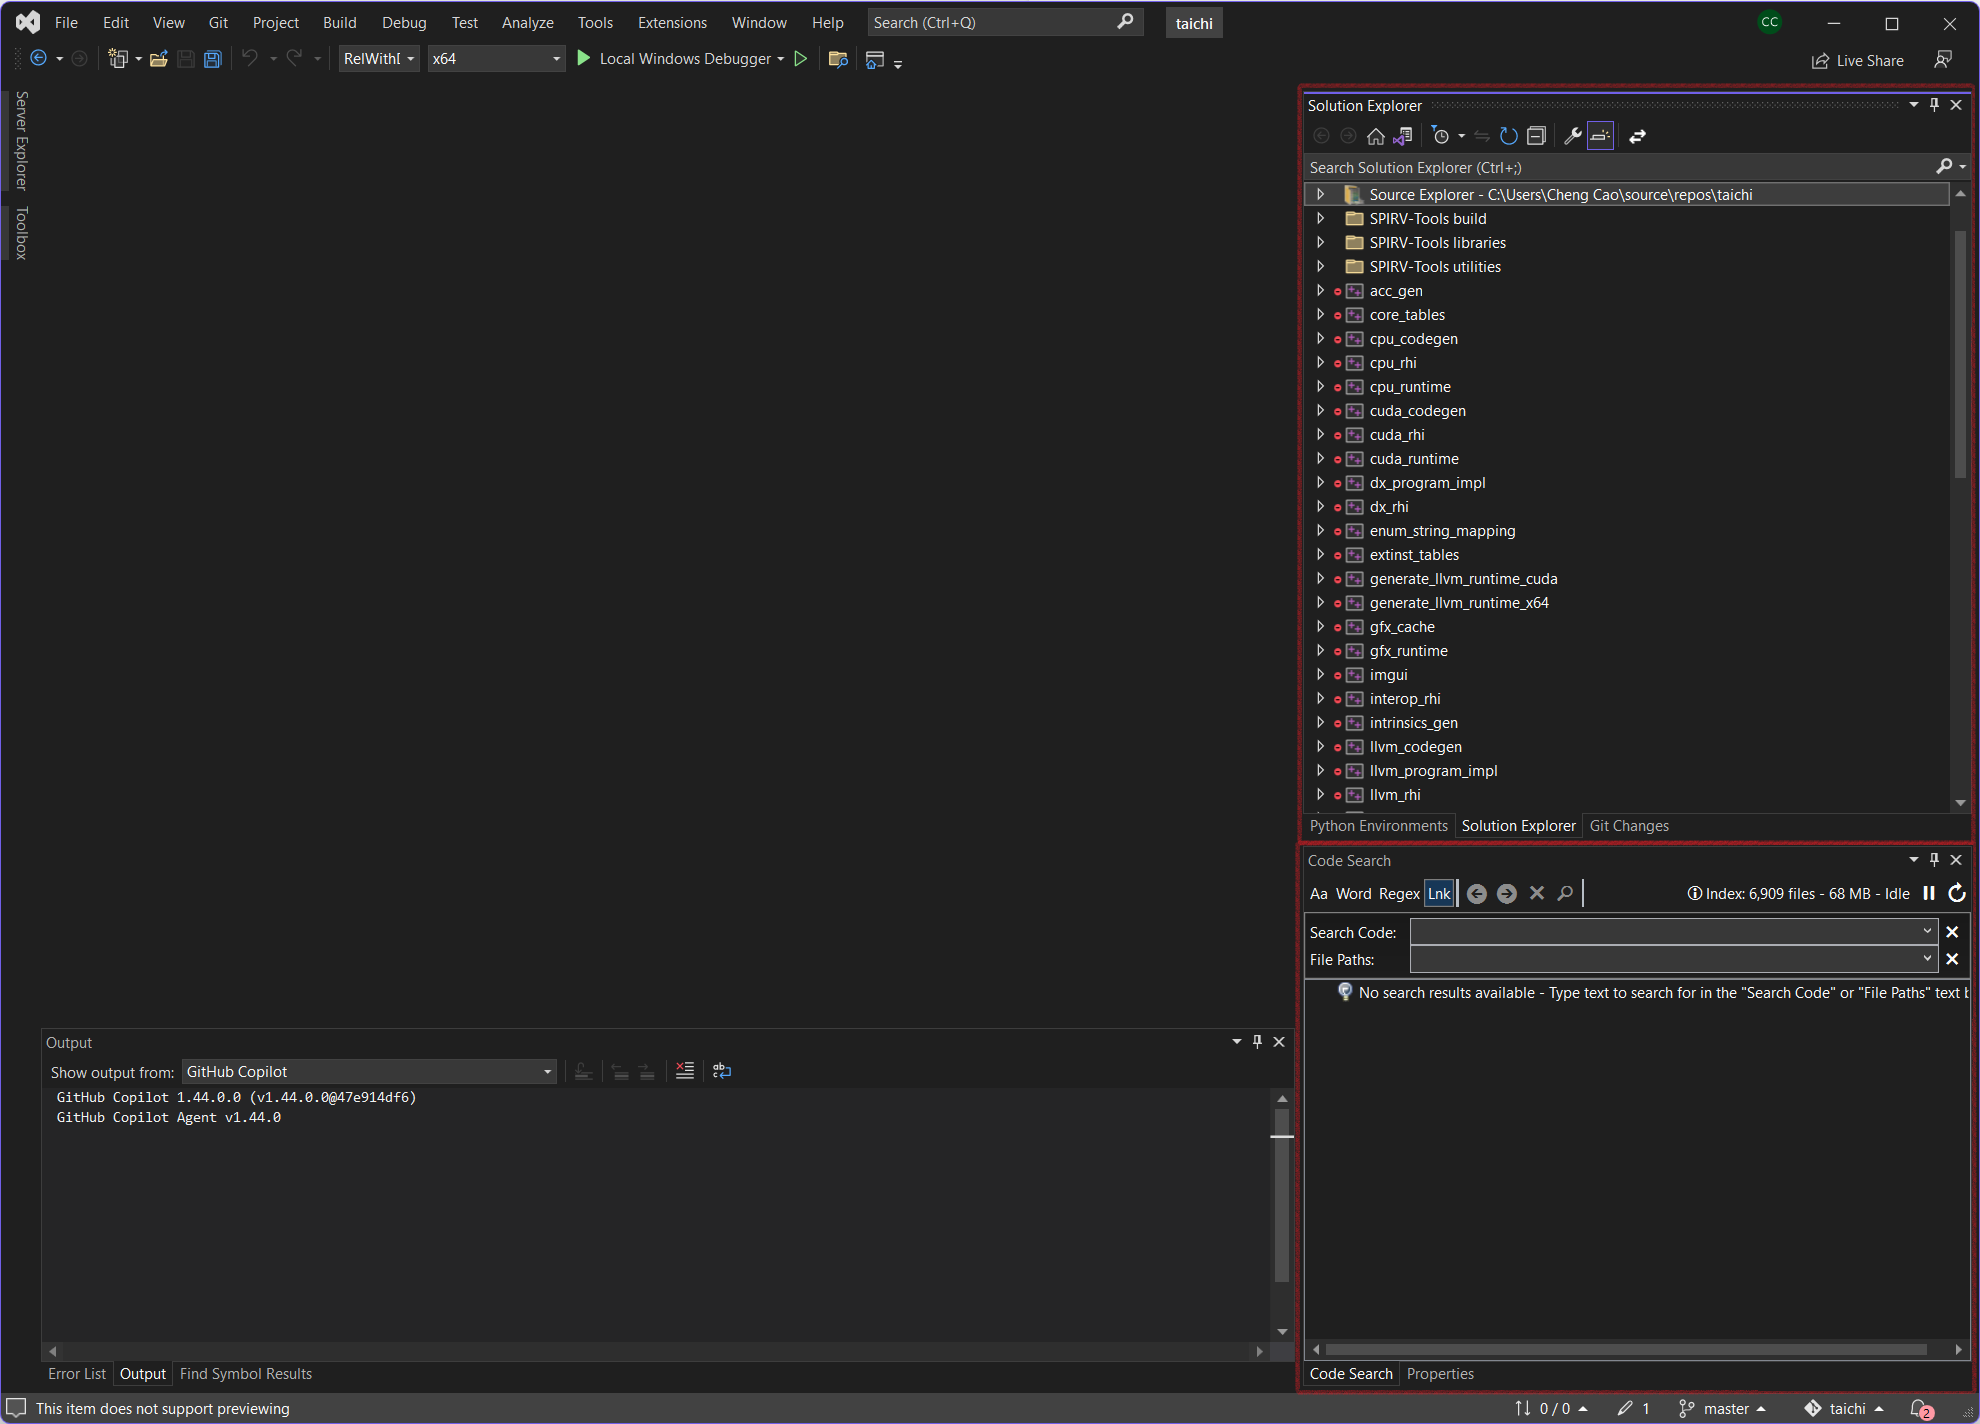
Step 3. Navigate through the source code of Taichi in Visual Studio
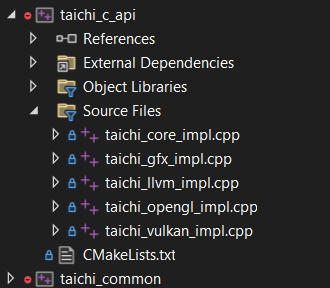
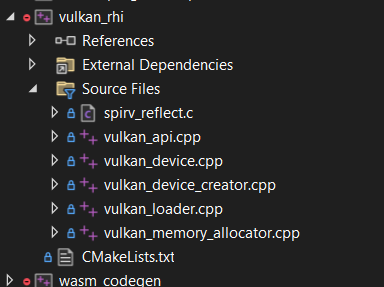
The top right red box is the solution explorer, where you can see each submodule of Taichi grouped up by each “object file”. Click on one, and you will see expanded details as the following images show:
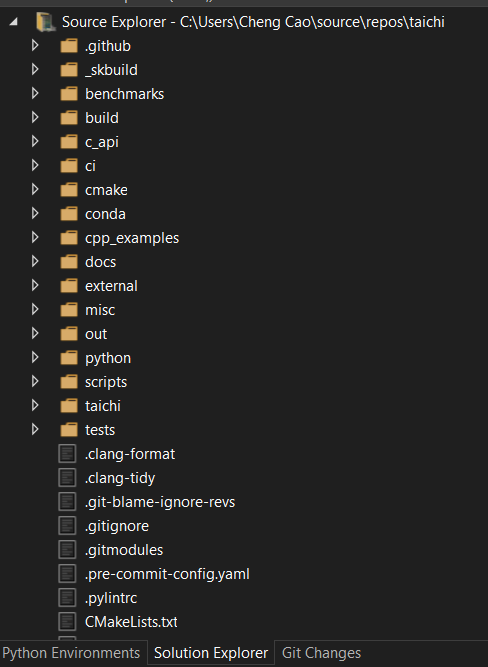
Or if you prefer navigating the project using its folder structure, you can find the “Source Explorer” module, and it should reveal the normal Taichi source directory structure:
If you are already familiar with the source code or try to locate the definition of a particular class, Code Search makes it quicker and easier to find the corresponding source code. Code Search is provided by the plugin VS Chromium, and you can find it by following View > Other Windows > Code Search. It is recommended that you keep this window pinned to have easy access to this great source navigation tool.
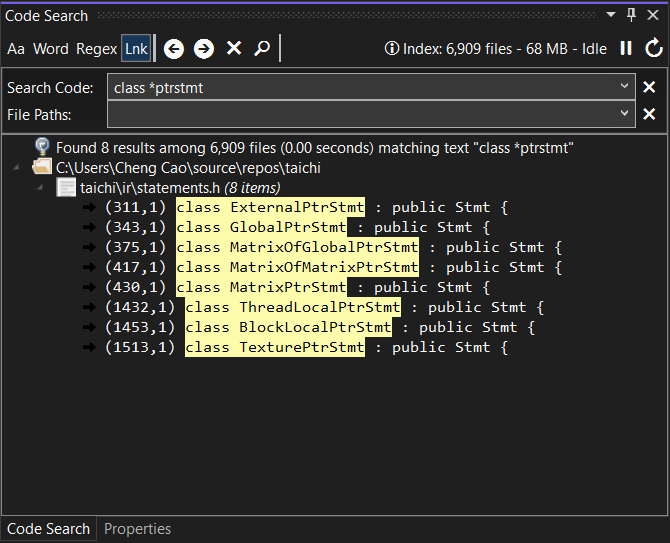
By default, Code Search uses the Windows search path wildcards with . ? and *. For example, the following image shows how to pin down where all pointer statements are defined, and clicking on one of the results brings you over to the particular line in that file:
note
Currently, Visual Studio has a bit of trouble parsing ir.h. You can ignore the errors reporting a failure to find the classes or types. Usually, they go away after a while.
Step 4. Debug Taichi
To debug Taichi on Windows, you can use one of the following two methods.
- Launch a Taichi program from Visual Studio and use it like any other IDE
- Insert
ti._lib.core.wait_for_debugger()in your Taichi program to pause the program. You can then attach to this process from Visual Studio. When this line of code is executed, the program will pause and now you can attach to this process from Visual Studio.
To launch a Taichi program from Visual Studio, go to Debug > ALL_BUILD Debug Properties and click Debugging on the left side for the debug launch settings. Set “Command” to the python executable file installed on your system (either in Conda or in other places). Then, set the working directory to ..\..\.., which points to the root of the Taichi source directory. Finally, set the argument to the python file you want to launch and its related options. For example:
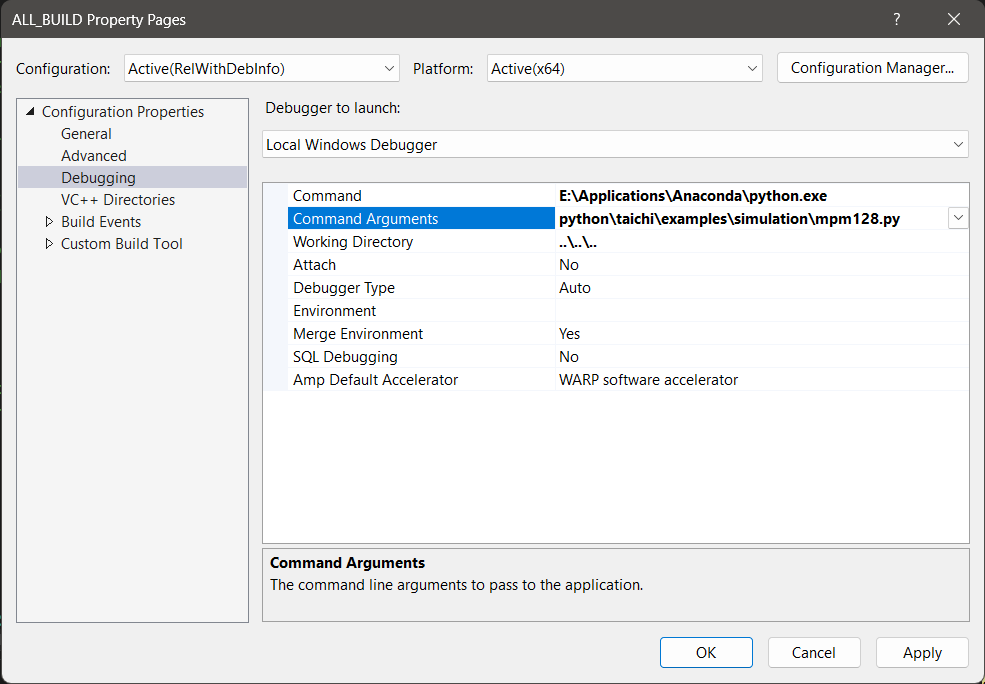
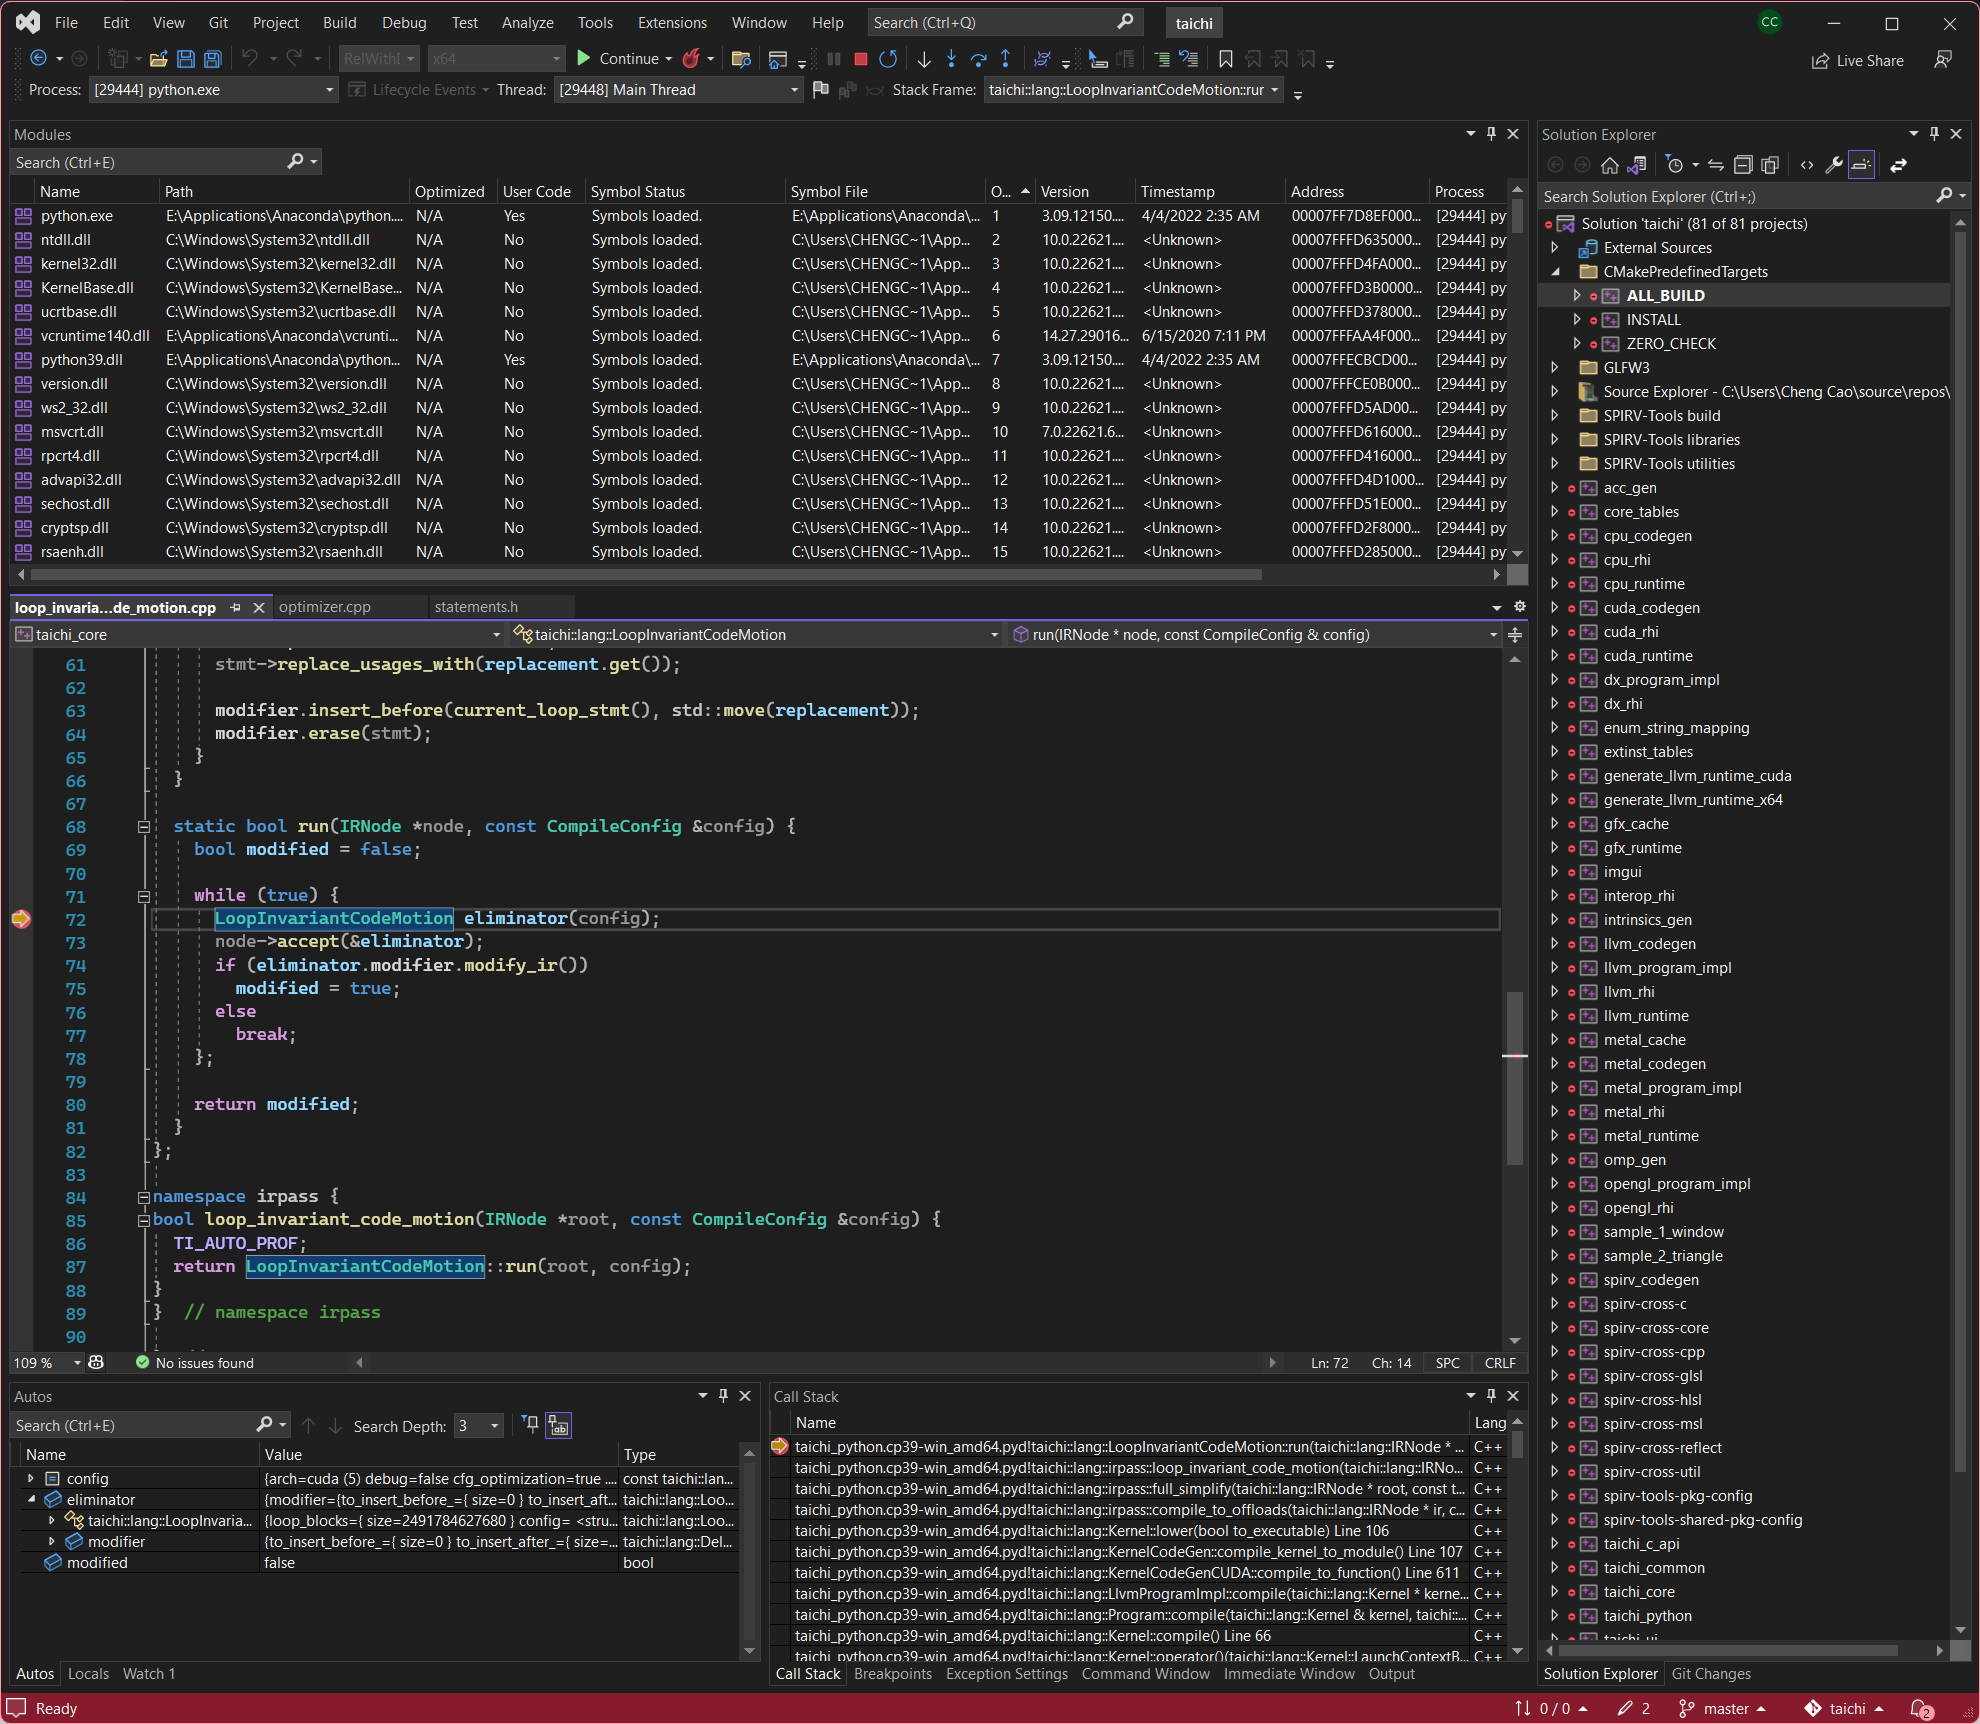
Hit OK or Apply to save this config, and click on the green run button (says “local windows debugger”) to launch the program. Here, we hit a break point set in one of the optimization passes:
If you use the other route and put a wait_for_debugger() in your python script, you can attach to the waiting process through Debug > Attach to Process. Afterward, the program resumes automatically.
Step 5. (CPU) Performance profiling
After the debugger (the green run button) is enabled, a new window titled “Diagnostic Tools” pops up, as the following image shows:
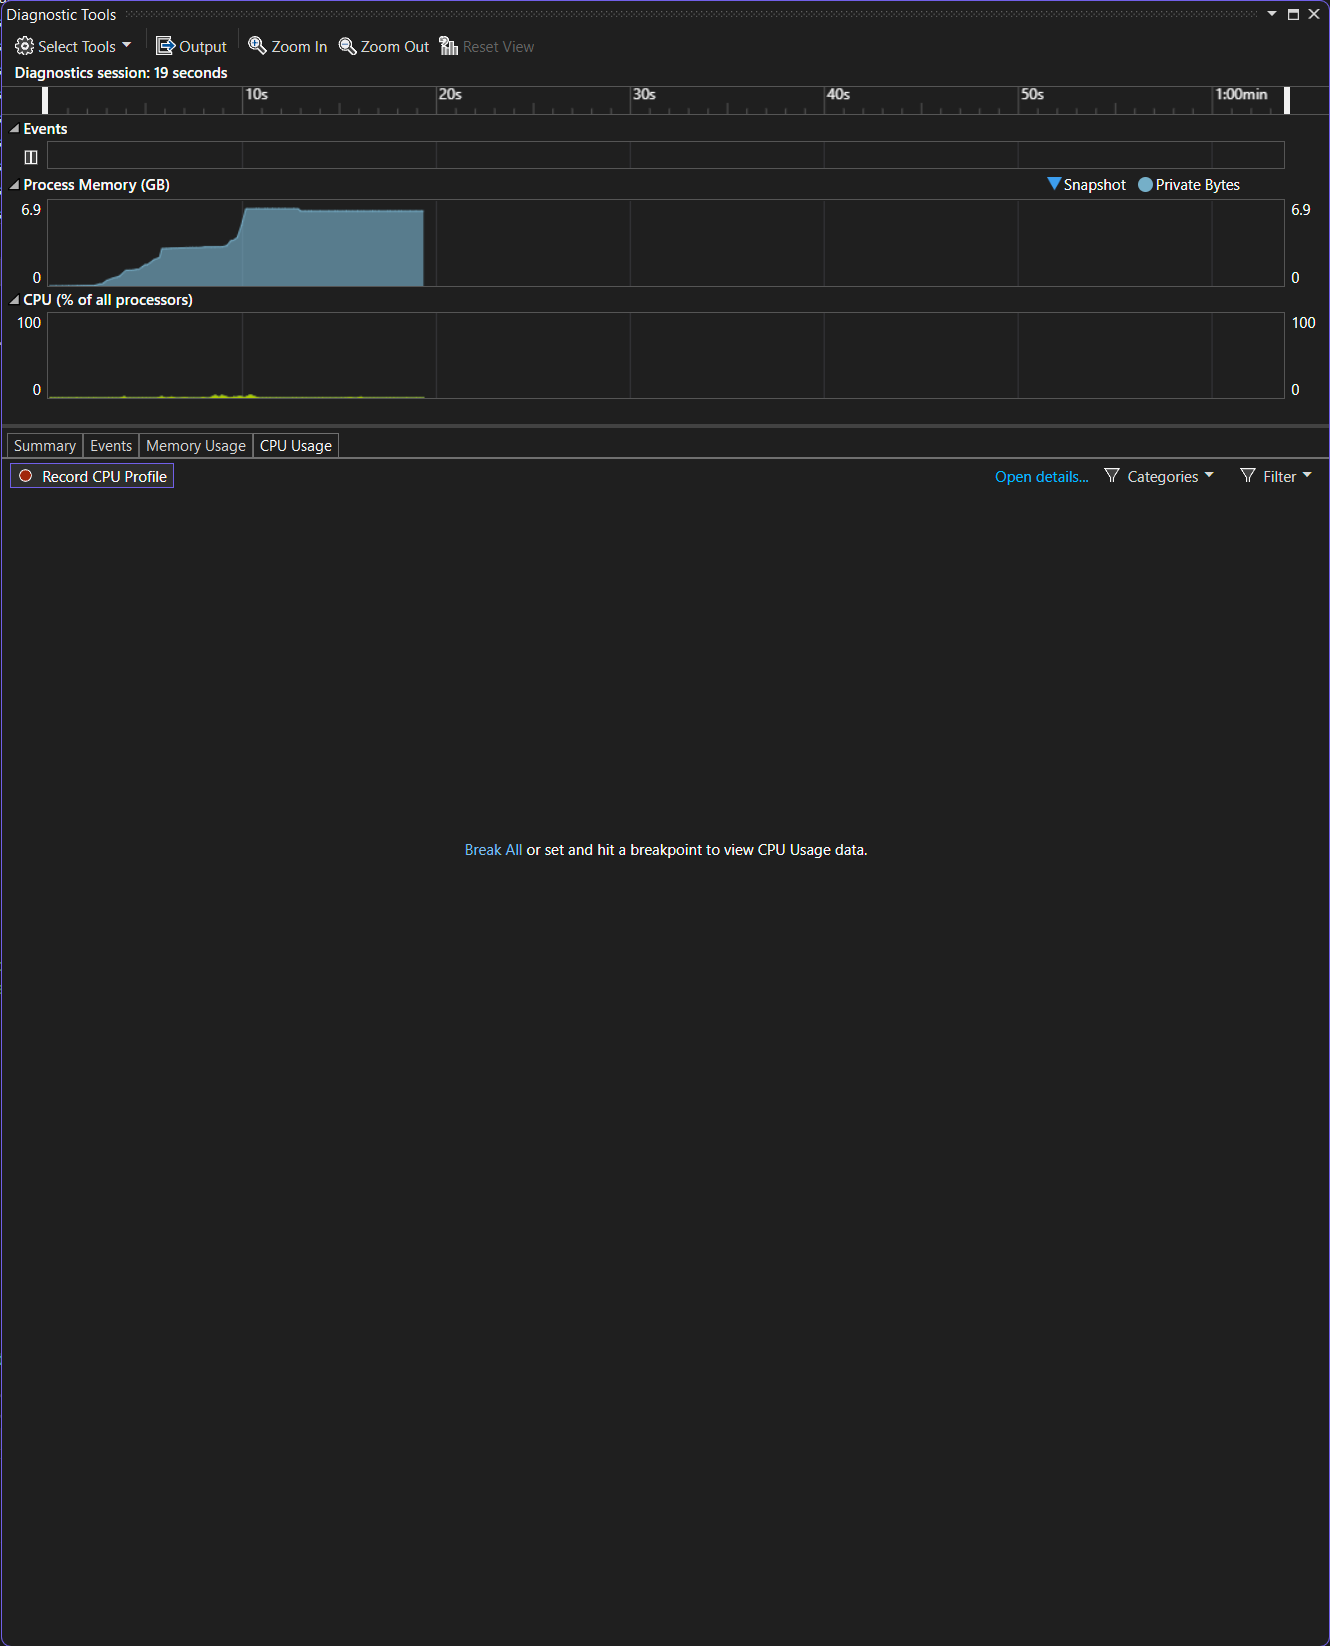
There are two useful tabs on this window: CPU Usage and Memory Usage. In each of them, you can find a “Record CPU Profile” option. Once you enable the option, the CPU timeline turns green and that means performance data is being collected in this duration.
Pause the debugging, and the profiling window shows the following:
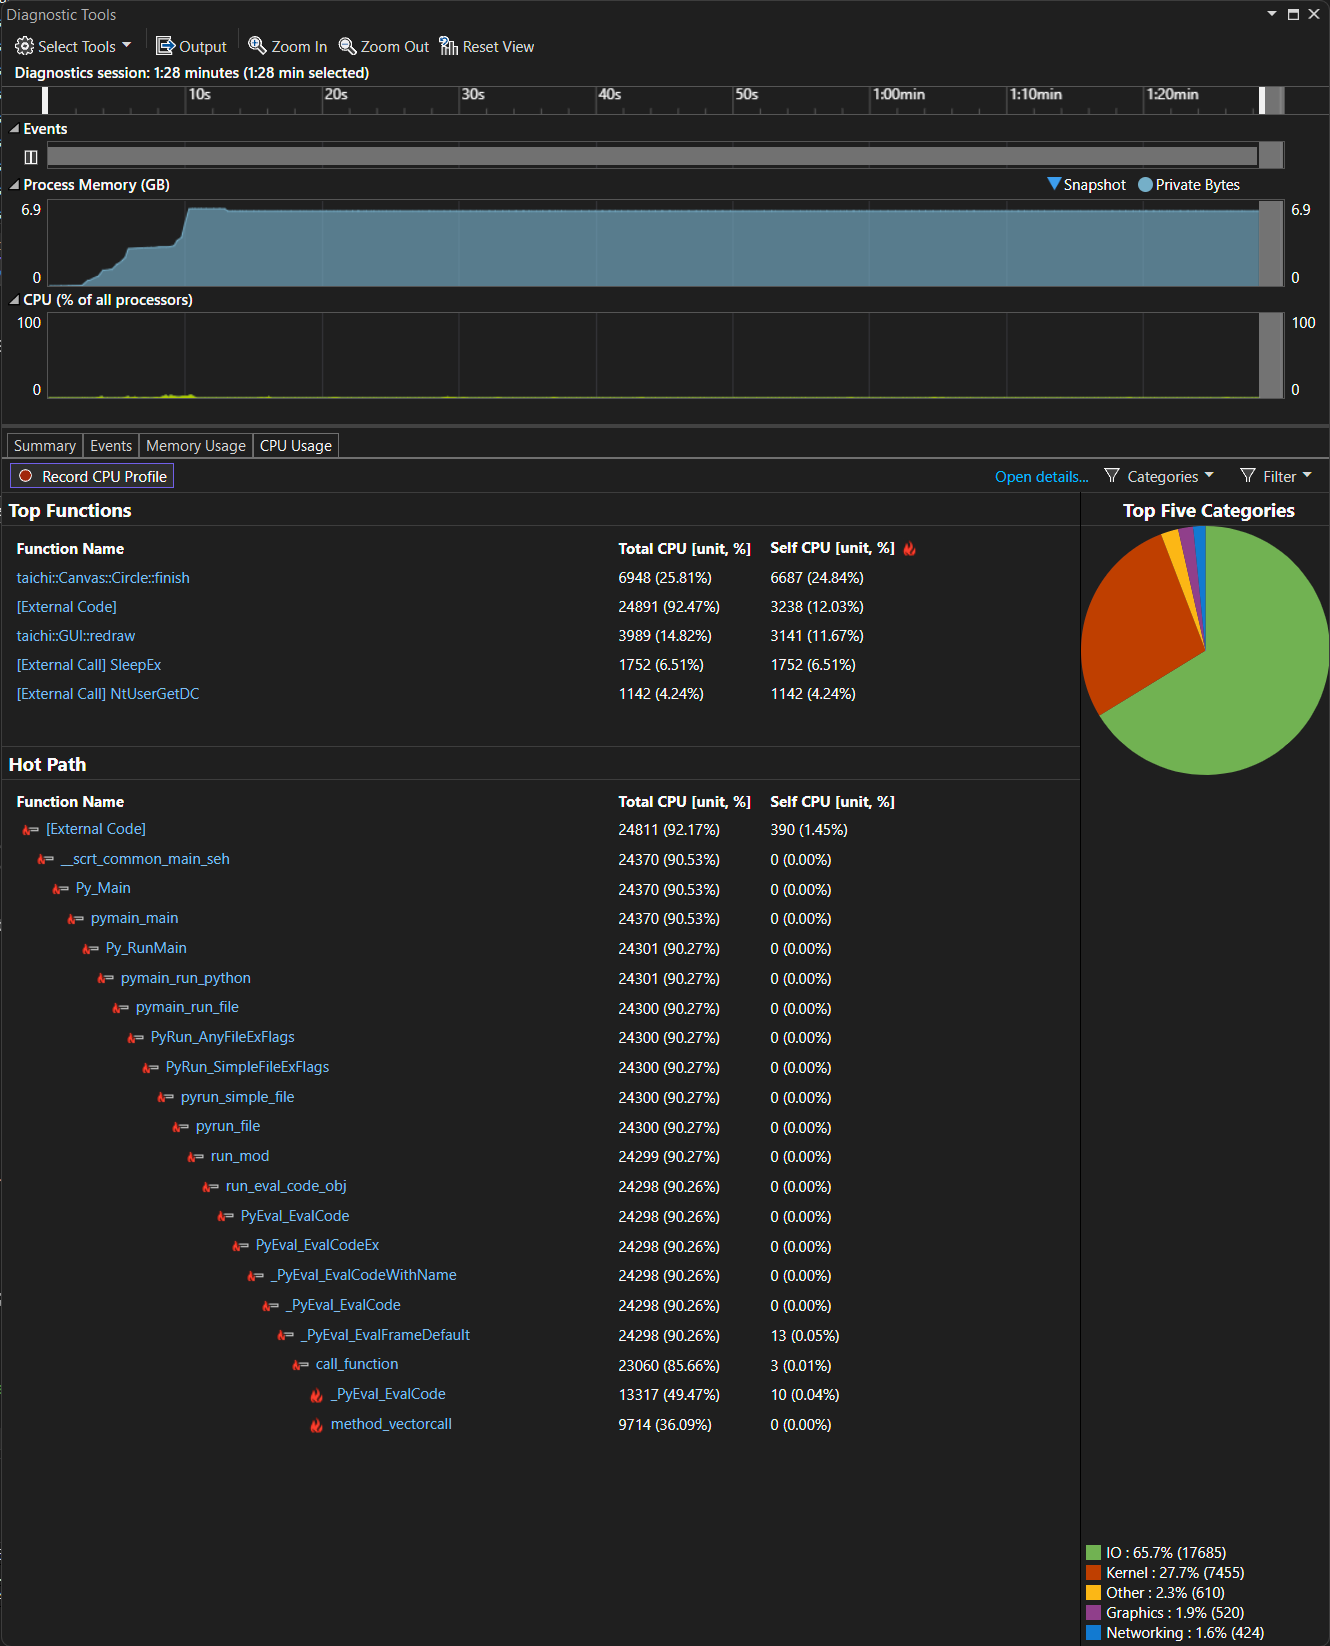
This is the collected profile of our program. We can select a region on the CPU timeline and only look at performance data in that region:
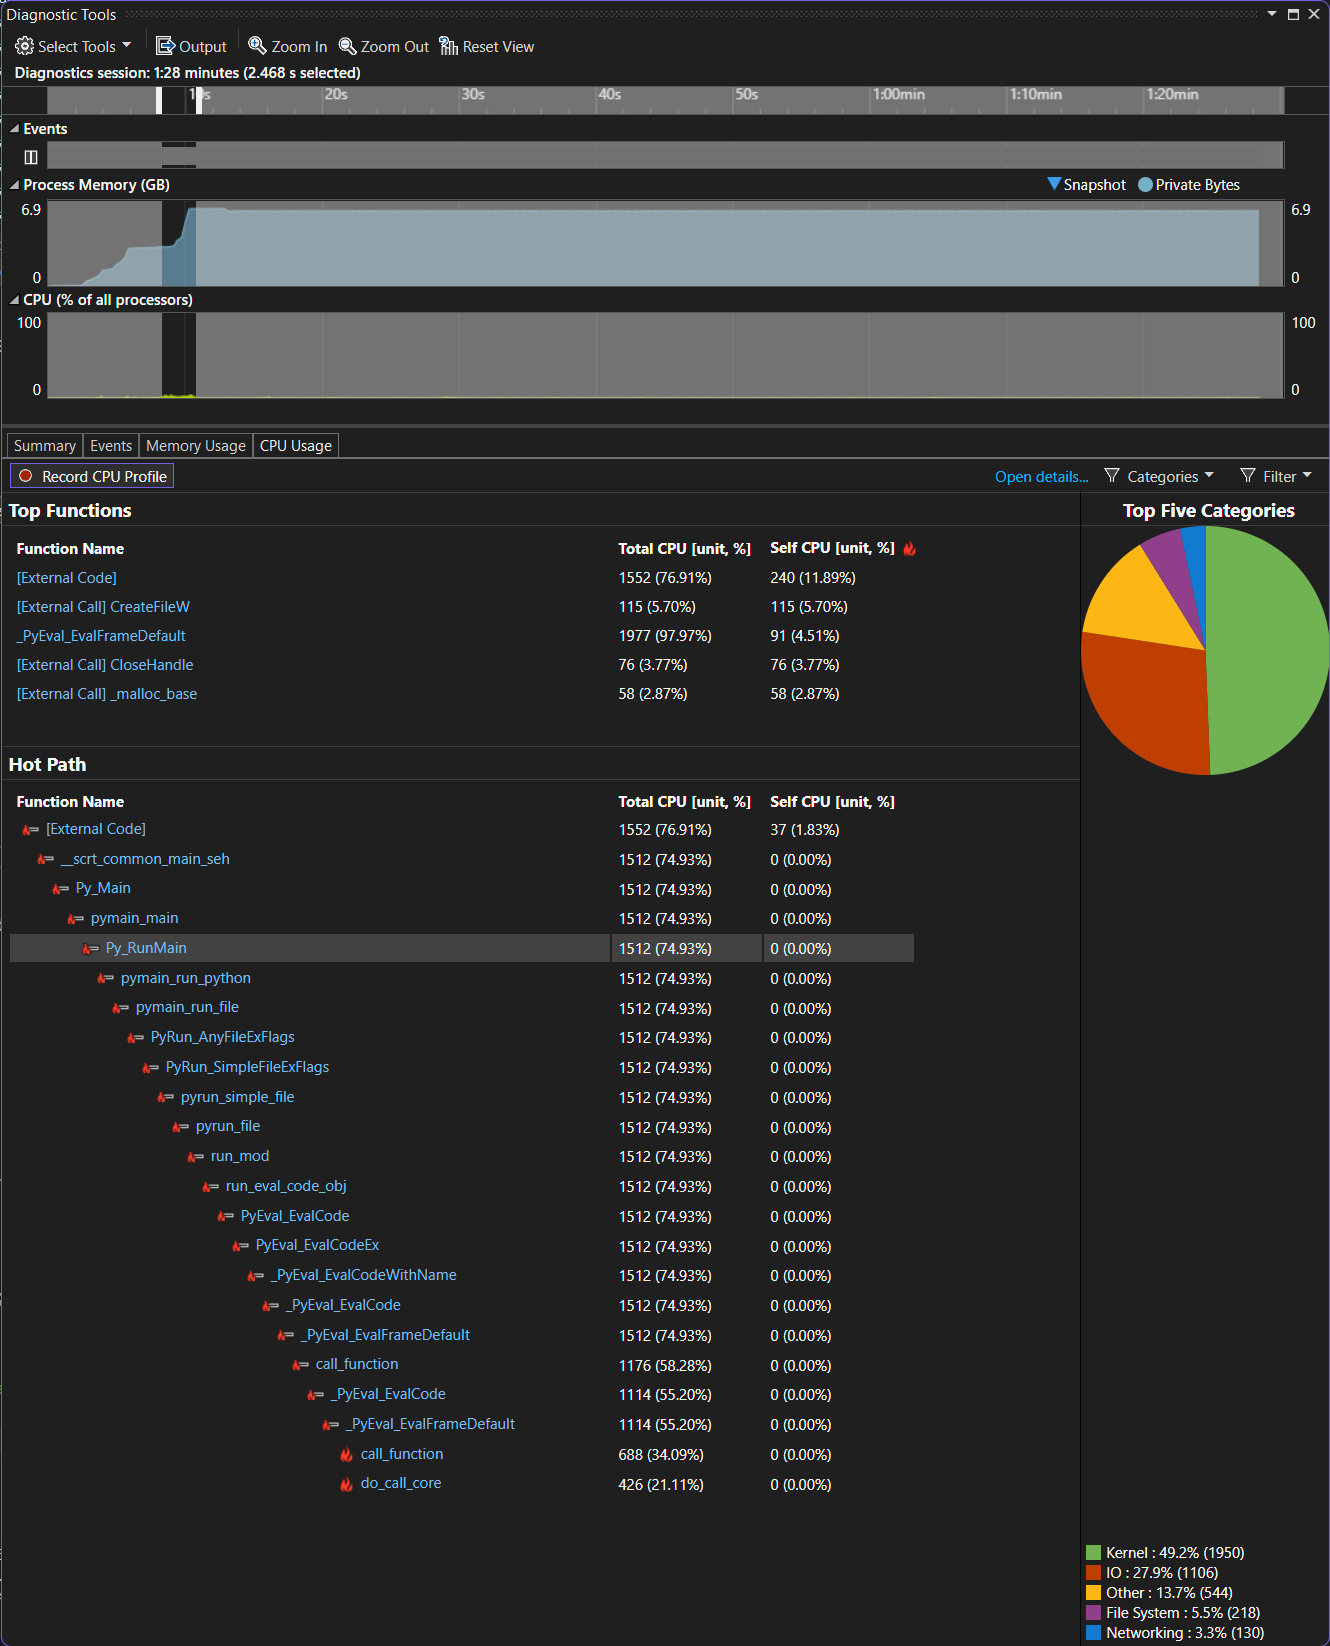
Here we can see the “Hot Path” of function calls. If we hit the “Open details” button, we can go into the detailed view containing the following sections: “Caller/Callee”, “Call Tree”, and “Modules”, “Functions”. Each of these presents performance data in a different way.
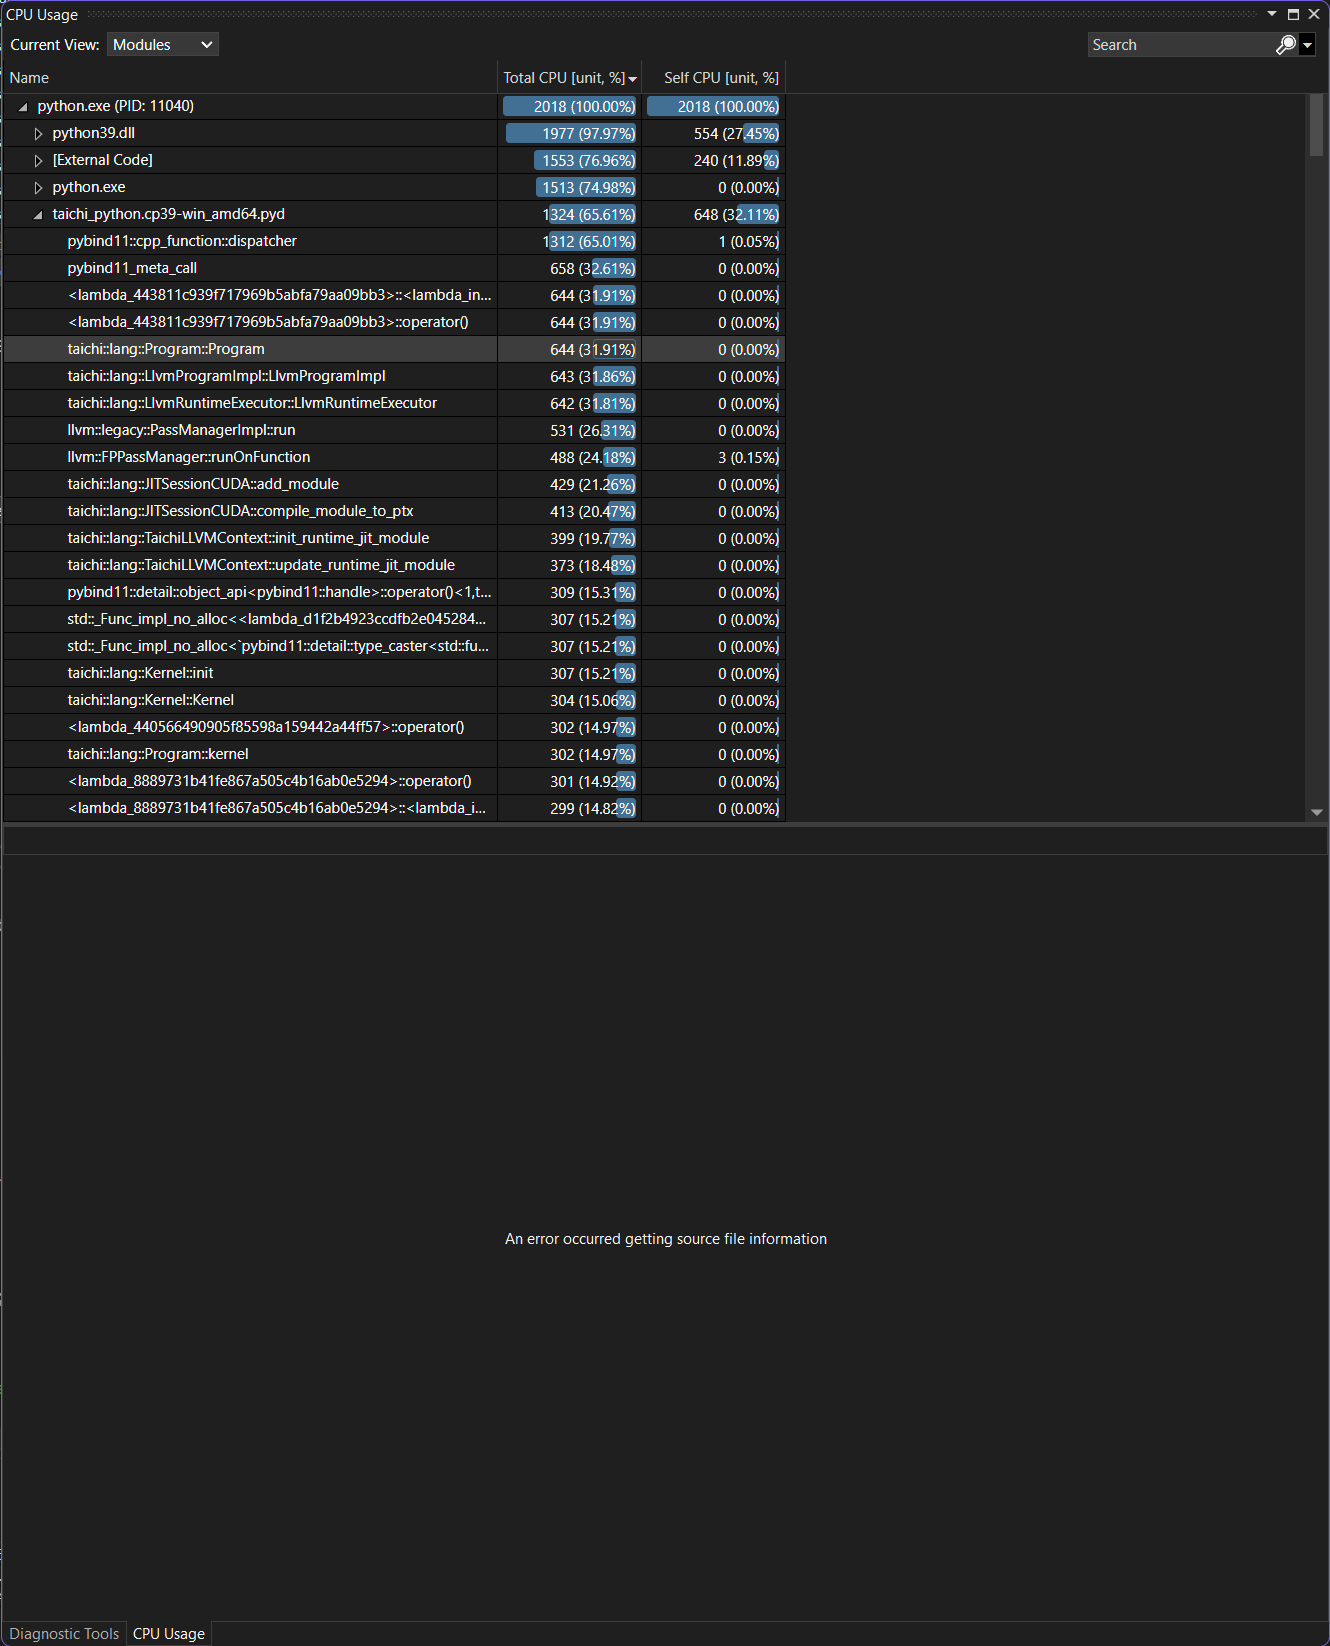
In this particular program, the hot path is within Python, and there is not much we can do to help. To optimize this part of code, go to the “Modules” view:
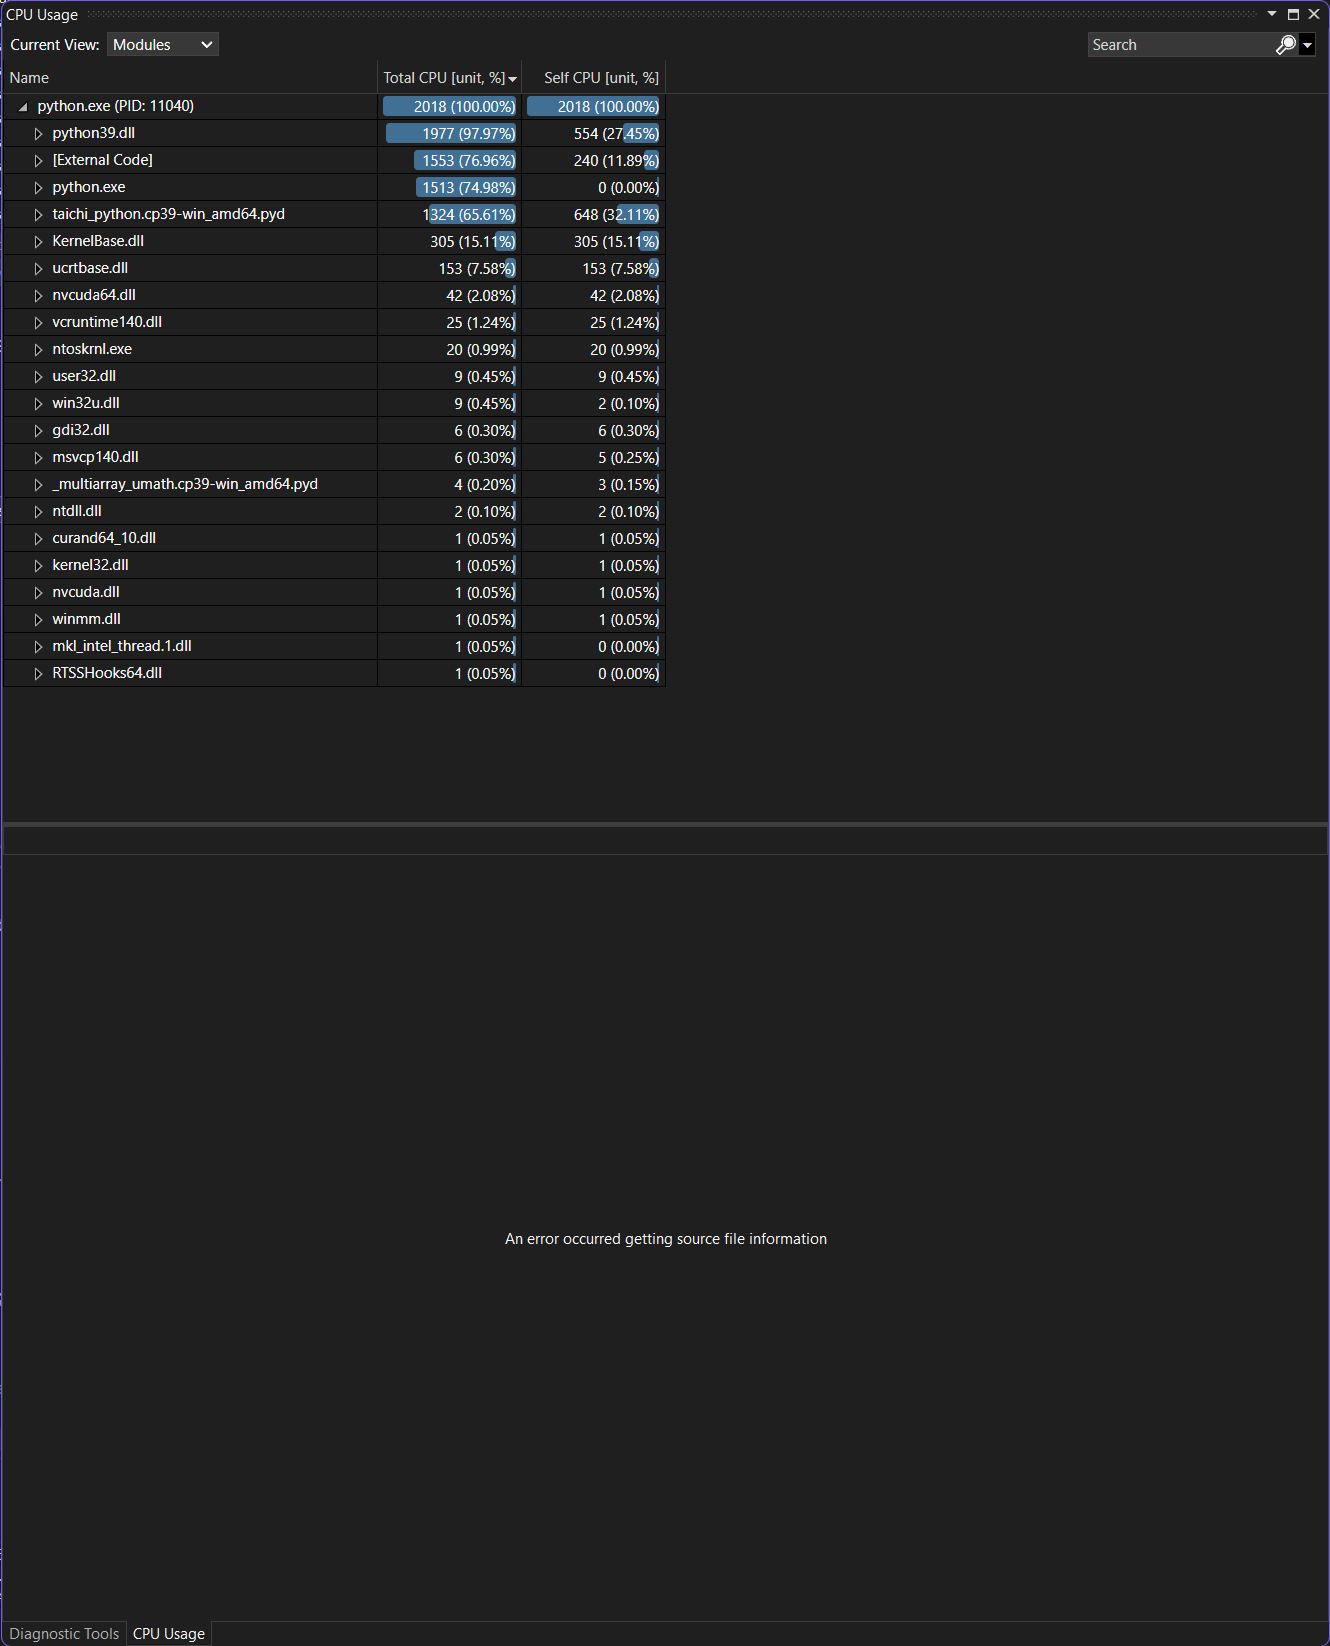
The taichi_python module (the C++ source code of Taichi) takes 65% of the total CPU time and splits its time down into the kernel and driver libraries.
Now, expand the library module:
Take this particular entry for example.

Right click on it and find View in Call Tree > expand hot path. The result is shown as below:
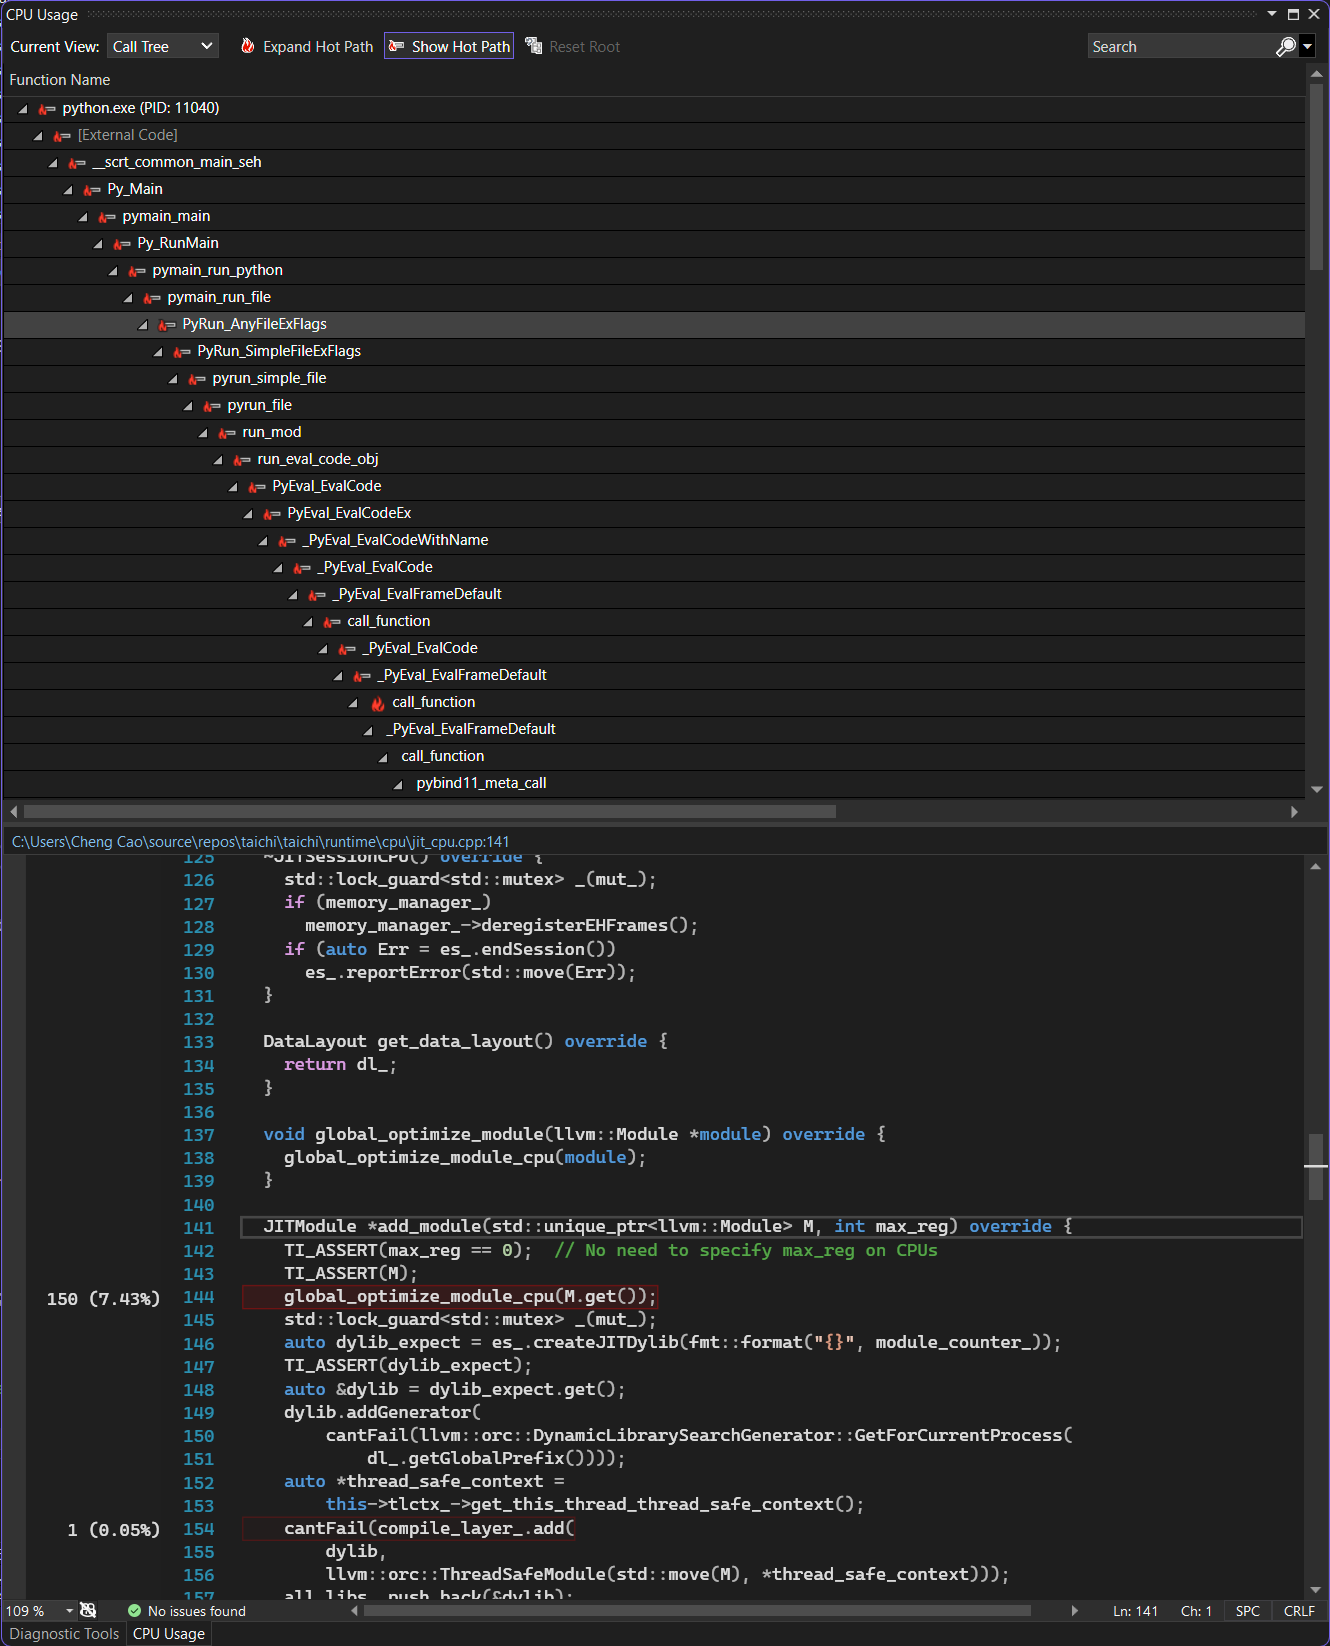
The Python stack is lengthy. We can scroll down to taichi::lang::JITSessionCUDA::add_module and right click on “Set Root” to get a much cleaner view. The function we care about is now the root of the call tree:
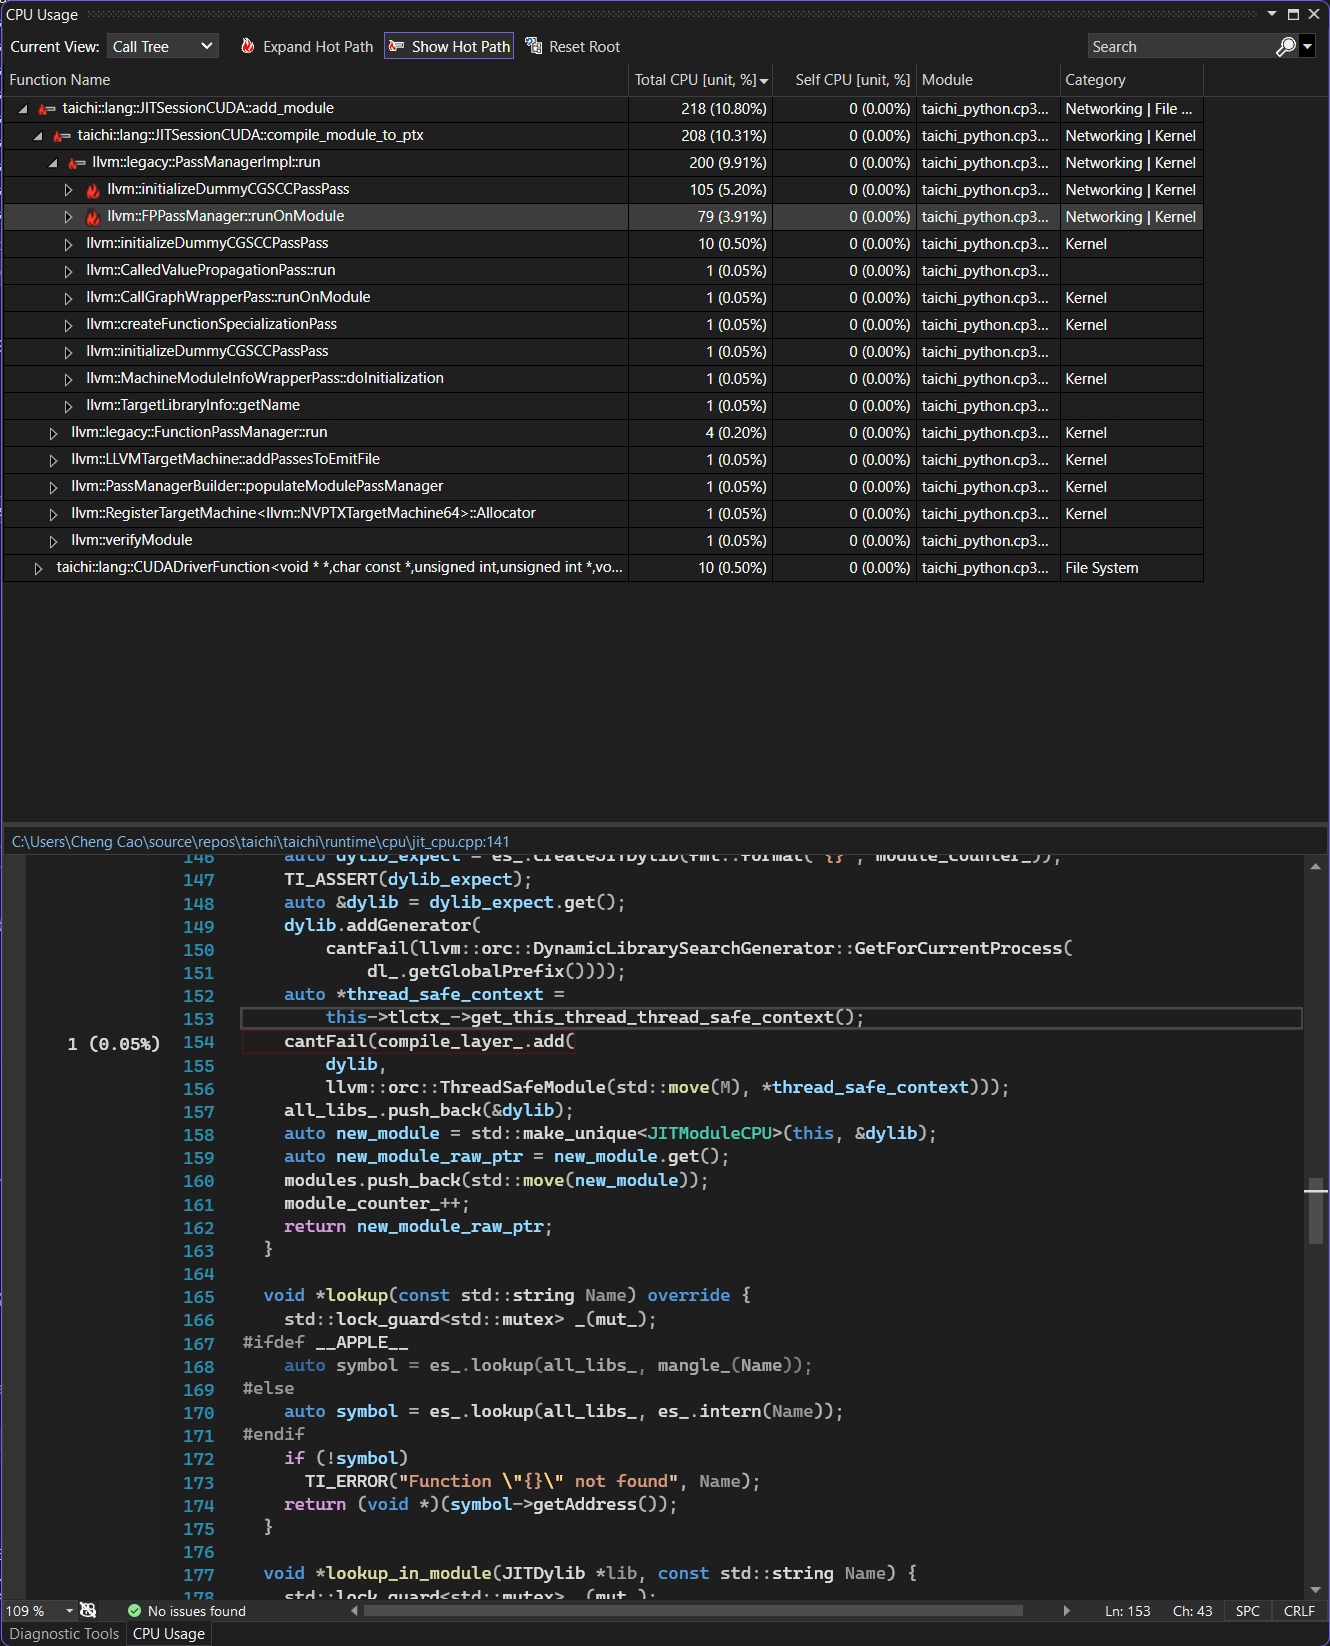
We can find out which pass and even which line of code are the most time-consuming.
In this case, LLVM occupies most of the time and leaves limited room for optimization. However, do not get frustrated. The point is that the technique introduced in this documentation applies everywhere and is most helpful to locate performance bottlenecks and facilitate problem-solving.